
The Stock-Bond Correlation
- Megan Czasonis, Mark Kritzman, and David Turkington
- Journal of Portfolio Management
- A version of this paper can be found here
- Want to read our summaries of academic finance papers? Check out our Academic Research Insight category
What are the research questions?
The correlation between stock and bond returns is an integral component of hedging strategies, risk assessment, and minimization of risk in allocation decisions. In the context of those strategies, the stock-bond correlation is typically estimated using monthly return data over a recent previous period. This is a reasonable approach but has turned out to be an unreliable indicator for forecasting purposes. The typical estimation assumes the correlation is unaffected by the interval of time that the return is calculated (i.e. weekly, monthly, annually, etc.). Among others, this is an extreme assumption that does not stand up to scrutiny. The historical evidence is clear that the stock-bond correlation with respect to the time interval used to measure returns is unstable, and most likely due to patterns of autocorrelation across returns. We have previously covered challenges within stock and bond correlations here.
In this paper, the authors conduct an incremental analysis of three innovations for reliably forecasting the long-term correlation of stocks and bonds.
The analysis proceeds as follows:
- First, economic and financial market predictors are identified and added to a purely extrapolative model. The extrapolative model serves as a baseline measure and is comparable to conventional methods currently in use. Fundamental predictors include economic growth , inflation , the relative level of earnings yield and volatility of stock and bond returns .
- The second innovation adds a ‘pathway’ for economic and financial variables to contribute to the estimation. Paths are included as values for five previous periods of the independent variables.
- Third, the partial sample regression, a relatively new approach to estimation, is used to forecast the long-term stock-bond correlation. Partial sample regression essentially filters the historical returns for relevance, where relevance is defined as a statistical concept that emphasizes observations with statistical similarity (“Mahalanobis distances”) to current observations. The reader is referred to the paper for more description.
- Returns on the S&P 500 Index are used to represent equity returns and the Bloomberg US Long Treasury Index is used to represent bond returns.
What are the Academic Insights?
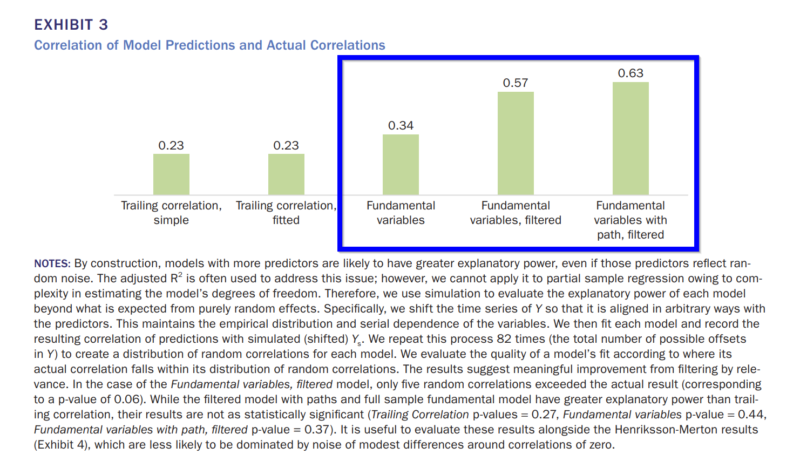
The correlation between the predictions from each model and the actual, subsequent single-period correlations of five-year returns are presented in Exhibit 3. With respect to models 1 and 2, the most common extrapolative approaches, the performance was weakest and least reliable. Each exhibited a correlation of .23 with future stock-bond correlations. When fundamental economic and financial variables are included the accuracy increases to .34 using the filtered regression. If variability in the path of those variables is included, accuracy increases to .57. In the best model, which uses the filtering function of the partial sample regression, the accuracy was .63. A three-fold improvement over current approaches. What’s not to like?!
Why does it matter?
This was a short but informative piece on improving the estimation of long-term correlations. Not only are the results applicable to the stock-bond correlation, but they should apply to other asset classes as well. For other pair-wise combinations of asset classes, an empirical analysis is still necessary to establish usefulness, although the concepts explored in this piece do apply. A description of the estimation of this statistic may appear to be a relatively tedious subject to review, but it’s importance in application to hedging and asset allocation strategies is central to their success. As with most of Kritzman’s work, a summary or a full read of the article, is definitely worth your time.
The most important chart from the paper
Abstract
Investors rely on the stock-bond correlation for a variety of tasks, such as forming optimal portfolios, designing hedging strategies, and assessing risk. Most investors estimate the stock–bond correlation simply by extrapolating the historical correlation of monthly returns; they assume that this correlation best characterizes the correlation of future annual or multiyear returns, but this approach is decidedly unreliable. The authors introduce four innovations for generating a reliable prediction of the stock-bond correlation. First, they show how to represent the correlation of single-period cumulative stock and bond returns in a way that captures how the returns drift during the period. Second, they identify fundamental predictors of the stock-bond correlation. Third, they model the stock–bond correlation as a function of the path of some fundamental predictors rather than single observations. Finally, they censor their sample to include only relevant observations, in which relevance has a precise mathematical definition.