
Responsible Investing: The ESG Efficient Frontier
- Pedersen, Fitzgibbons, and Pomorski
- Journal of Financial Economics, 2020
- A version of this paper can be found here
- Want to read our summaries of academic finance papers? Check out our Academic Research Insight category
What are the Research Questions?
The 2018 Global Sustainable Investment Review reports over $30 trillion invested with explicit ESG goals as of the beginning of 2018. In the words of the authors:
There is a clear tendency for many investors to own ethical companies in a saintly effort to promote good corporate behavior while hoping to do so in a guiltless way that does not sacrifice returns.
To empower future investors in the ESG space we have made a considerable effort to report on the academic research findings in this space. For further reading on ESG check out some of our previous work:
Research hasn’t conclusively determined if incorporating ESG components into a portfolio adds value or not. In short, there are intense debates surrounding the basic question of, “Does ESG improve risk-adjusted returns?”
This paper attempts to reconcile the opposing views by introducing a framework to evaluate the costs and benefits of responsible investing.
What are the Academic Insights?
The authors identify three types of investors:
- Type-U (ESG-unaware) investors are unaware of ESG scores and simply seek to maximize their unconditional mean-variance utility.
- Type-A (ESG-aware) investors also have mean-variance preferences, but they use assets’ ESG scores to update their views on risk and expected return.
- Type-M (ESG-motivated) investors use ESG information and also have preferences for high ESG scores.
By showing that the investor’s problem can be reduced to a trade-off between ESG and Sharpe ratio, the authors find the following:
- The benefit of ESG information can be quantified as the resulting increase in the maximum Sharpe ratio (relative to a frontier based on only non-ESG information). The cost of ESG preferences can be quantified as the drop in Sharpe ratio when choosing a portfolio with better ESG characteristics than those of the portfolio with maximum Sharpe. Type-A investors choose the portfolio with the highest SR, that is, the tangency portfolio using ESG information in Fig.1, Panel A. Type-M investors have a preference for higher ESG, so they choose portfolios to the right of the tangency portfolio, on the ESG-efficient frontier. Type-U investors may choose a portfolio below the frontier, because they compute the tangency portfolio while ignoring the security information contained in ESG scores (they condition on less information). Empirically, when ESG is proxied for by a measure of governance (G) based on accruals and no constraints are used, the maximum SR is achieved for a relatively high level of ESG. When realistic constraints (i.e.screening out stocks with the weakest ESG characteristics) are imposed on the portfolio, there is a downward shift in the ESG-SR frontier.
- Equilibrium asset returns satisfy an ESG-adjusted capital asset pricing model (CAPM), showing when higher ESG assets have lower or higher equilibrium expected returns. This model is the first to explicitly model heterogeneity in how investors use ESG information. This heterogeneity results in a range of possible equilibria depending on the relative importance of each investor type, leading to a relation between ESG and expected returns that is positive, negative, or neutral.
- The costs and benefits of responsible investing are estimated via the empirical ESG-efficient frontier based on environmental (E) and governance (G) measures and show how ESG screens can have surprising effects.
- Equilibrium predictions are tested using four ESG proxies (E- how green a company is with each company’s carbon intensity; S with a sin stock indicator defined in Hong and Kacperczyk (2009), G-how (un)aggressive a company is in its accounting choices based on the accruals in the financial statements (Sloan, 1996) and a measure of overall ESG with the aggregate ESG score produced by MSCI) providing a rationale for why certain ESG measures predict returns positively (some aspects of governance) and others negatively (non-sin stocks, a measure of S) or close to zero (low carbon emissions, an example of E, and commercial ESG measures).
Why does it matter?
This paper attempt at bridging the gap between papers arguing that ESG hurts performance and those arriving at the opposite conclusion. The former group, based on the segmentation theories, is supported by empirical literature showing that sin stocks (alcohol, tobacco, and gaming, which can be seen as a poor S in ESG) generate positive abnormal returns. Papers in the latter group show that stocks with good governance (the G in ESG) generate positive abnormal returns as do stocks with higher employee satisfaction (part of the S of ESG). The model and empirical results proposed by the authors help explain these opposing findings: ESG is a positive return predictor if ESG is a positive predictor of future firm profits and the value of ESG is not fully priced in the market. Further, the model predicts that this relation can be weakened with ESG becoming a neutral return predictor when most investors see the value in ESG. This may lead to ESG becoming a negative predictor of returns because investors are willing to accept lower returns for more responsible stocks.
To give some specific examples. the results of Hong and Kacperczyk (2009) arise because their measure of sin stocks (belonging to the industries related to alcohol, tobacco, and gaming) is associated with low investor demand, while the ESG measures of Gompers et al. (2003) and Edmans (2011) are related to higher firm profits in a way that the market has not fully appreciated.
The Most Important Chart from the Paper:
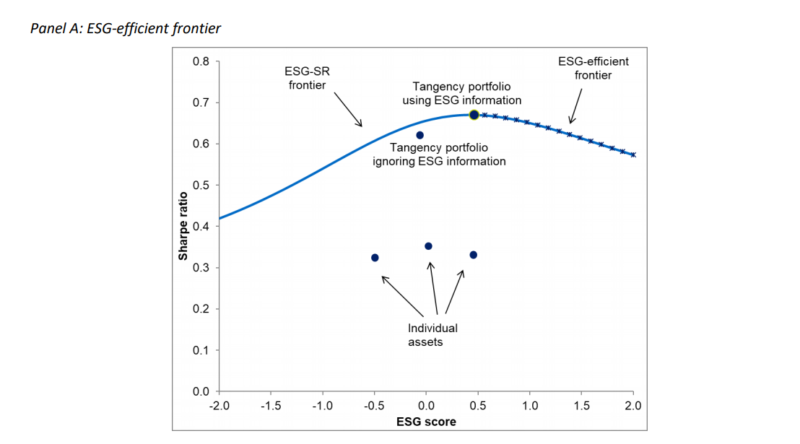
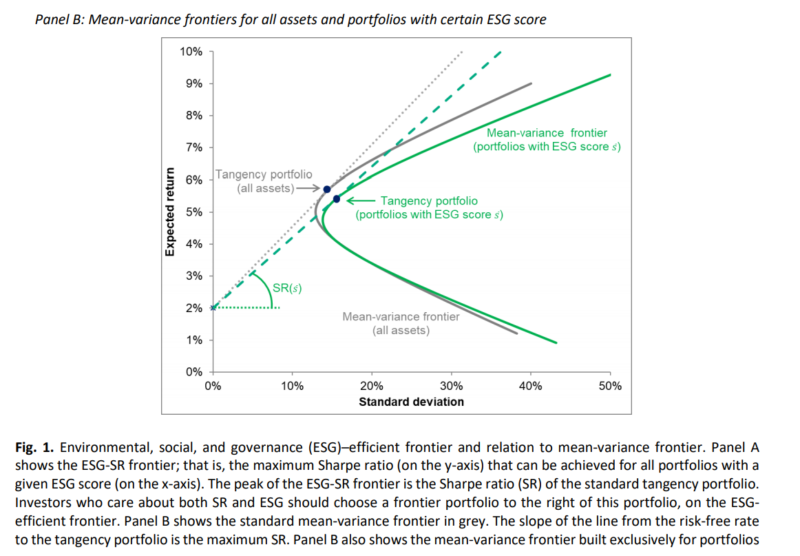
To understand why the ESG-SR frontier is hump-shaped, consider first the tangency portfolio known from the standard mean-variance frontier, shown in Fig. 1 Panel B. This tangency portfolio has the highest SR among all portfolios, so its ESG score and SR define the peak in the ESG-SR frontier. Further, the ESG-SR frontier is hump-shaped because restricting portfolios to have an ESG score other than that of the tangency portfolio must yield a lower maximum SR, as illustrated in Panel B.
Abstract
We propose a theory in which each stock’s environmental, social, and governance (ESG) score plays two roles: (1) providing information about firm fundamentals and (2) affecting investor preferences. The solution to the investor’s portfolio problem is characterized by an ESG-efficient frontier, showing the highest attainable Sharpe ratio for each ESG level. The corresponding portfolios satisfy four-fund separation. Equilibrium asset prices are determined by an ESG-adjusted capital asset pricing model, showing when ESG raises or lowers the required return. Combining several large data sets, we compute the empirical ESG-efficient frontier and show the costs and benefits of responsible investing. Finally, we test our theory’s predictions using proxies for E (carbon emissions), S, G, and overall ESG.